Table of Content
- Request Configuration
- PWS Configuration Parameters
- Progressive Web Service instantiation
- PWS connection parameters
- Chromium remote debuging
- Inspect app with PWS remote devtools
Request Configuration
The process of installing (supplying) a software and providing it as a service (instantiation) are the same for all software. However during instantiation each instance can be configured differently.
This section will cover the specific configuration parameters used to request a PWS service on Rapid.Space platform.
PWS Configuration Parameters

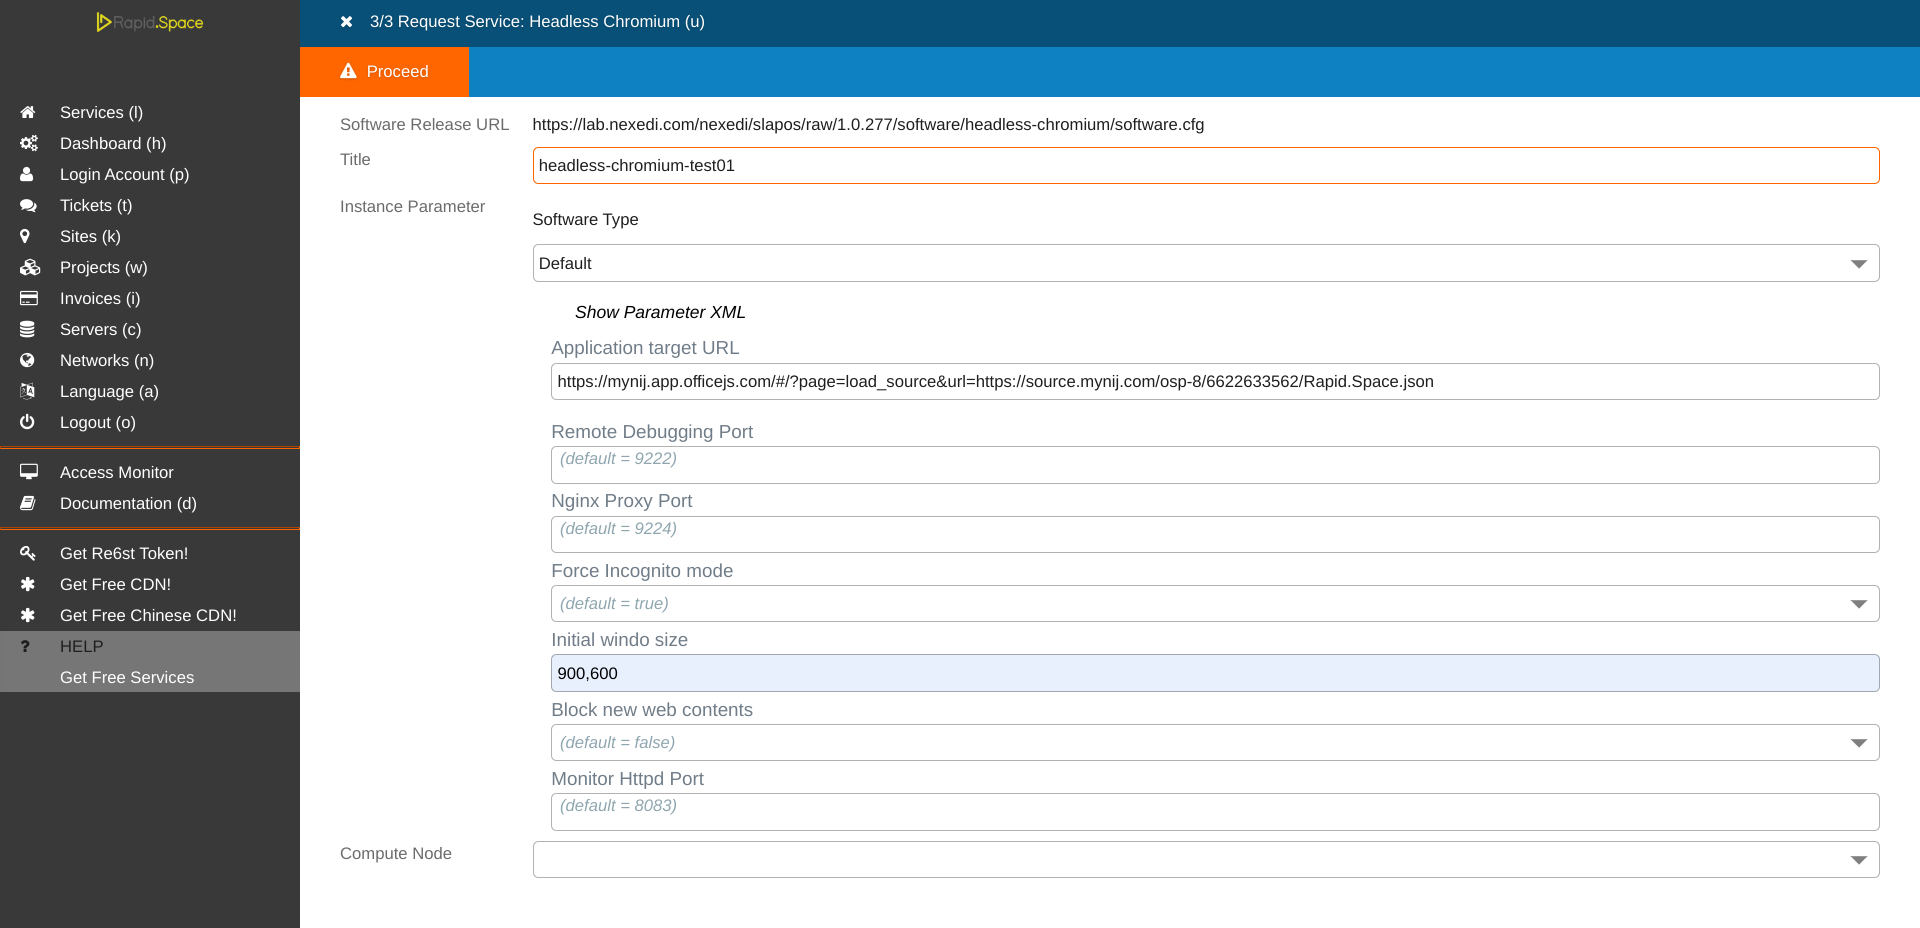
After selecting Services, Adding a new service, selecting Headless Chromium and the latest release, you should reach the PWS configuration page.
The software type Default is for deploying PWS instance, it's automatically selected because there is only one software type with PWS software release. Give a name to your service and fill parameters which will be used for deployment.
Parameter Application target URL is the URL of PWA (Progressive Web App) to load on headless chromium, it's a mandatory parameter.
Remote Debugging Port is the port for Chromium to listen on.
Nginx Proxy Port is the port for nginx reverse proxy.
Force Incognito mode will start the browser in Incognito mode.
Initial window size define the initial browser window size.
Block new web contents will block all pop-ups and calls to window.open will fail.
After parameters are updated, click on Proceed to start instantitation.
Progressive Web Service instantiation

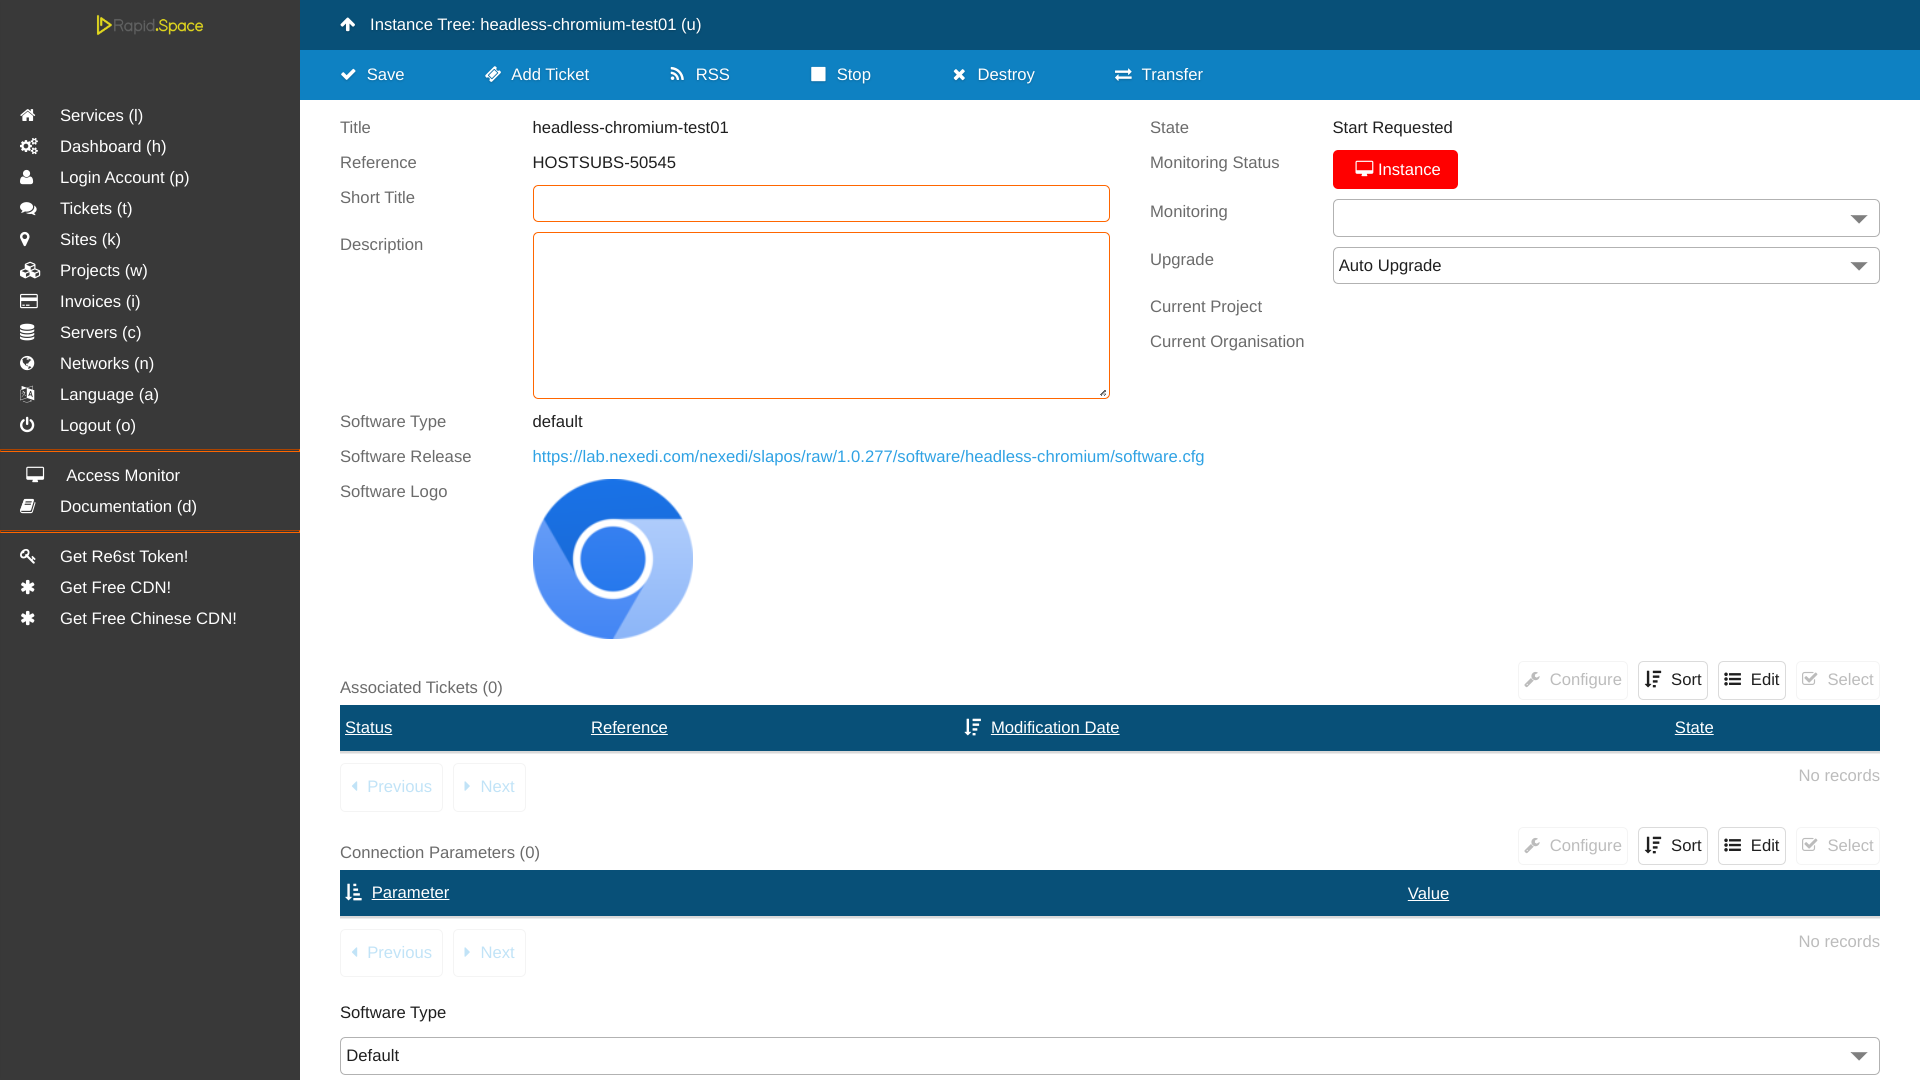
Once you've started instantiation, you will be forwarded back to the list of deployed services. Note that you might have to refresh the page for your new instance to appear. When you can see it, click on corresponding entry to open the requested instance.
If you have access to the slapos node server, you can follow the deployment by looking at the slapos-node-instance.log using:
# tail opt/slapos/log/slapos-node-instance.log -f
PWS connection parameters

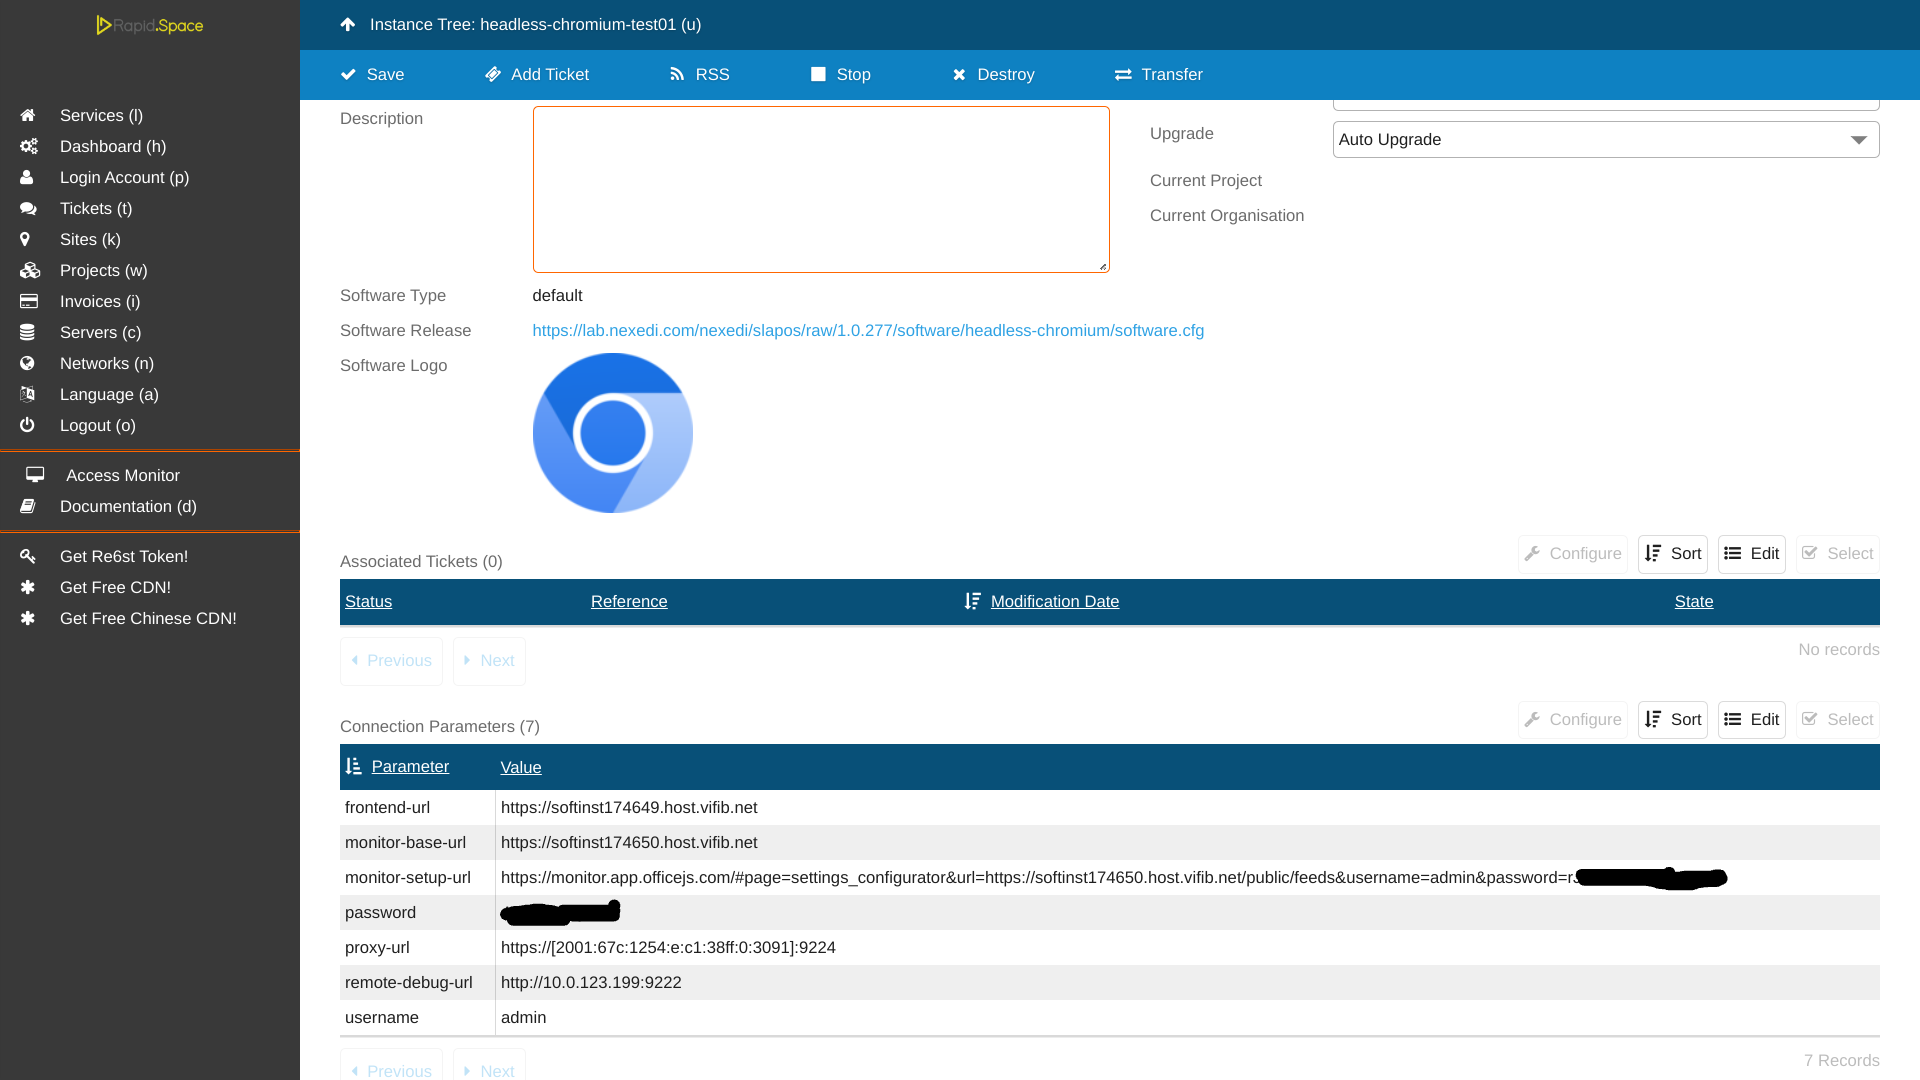
Once connections parameters are correctly shown and frontend-url entry shows a valid URL, the headless browser is running. The monitoring of the instance should be also green. Use frontend-url to access the remote debugging with the DevTools protocol, then provide username and password generated by slapos when asked.
Chromium remote debuging

When you open frontend-url and authenticate with login and password you, should be able see the home page with a link to open browser inspector of your app. In our case, The PWS load Mynij Search PWA, we can see in the picture a link "Mynij Search" which open the Inspectable WebContents.
Inspect app with PWS remote devtools

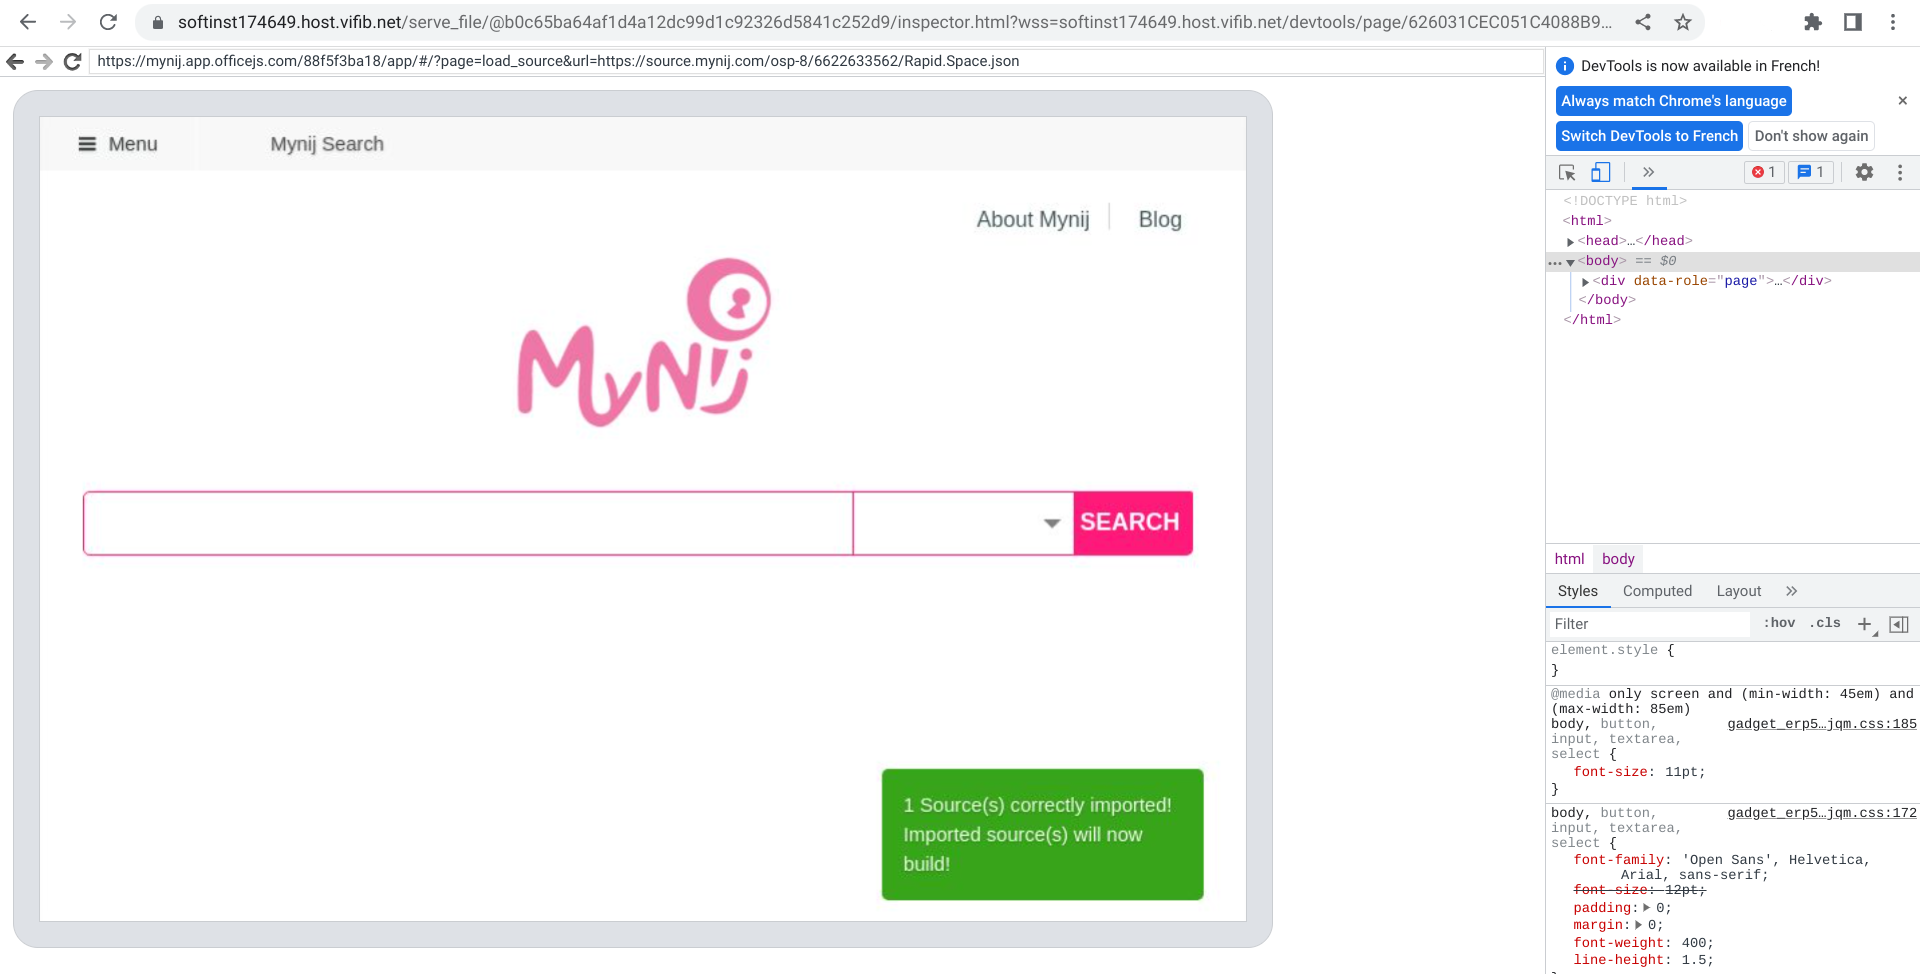
After a click on inpector link of PWA, a new page is loaded which show remotely what is loaded in the browser. We can see the web page loaded into headless chromium and, at the right side, there is a devtools for inspecting the web contents.
The PWS start a DevTools Protocol server which allow clients to create WebSocket and start sending CDP commands to the browser, this can be used for example to run selenium functional tests. WebSocket URL can be found by navigating to [frontend-url]/json or [frontend-url]/json/version.
For more details about how to use headless chromium with Devtools Protocol, follow these links:
https://chromedevtools.github.io/devtools-protocol/tot/Browser
https://github.com/aslushnikov/getting-started-with-cdp
Thank You
- Nexedi SA
- 147 Rue du Ballon
- 59110 La Madeleine
- France