THIS IS A DRAFT
Today's javascript libraries could do awesome rendering in web browsers. When looking for doing developments of tools allowing to help humans taking decisions on complex processes, I'm looking for javascript tools that would allows representing nice flowcharts. You will find below 10 libraries, and for each of them I would try to check some criterions to evaluate which could be be good to use.
JsPlumb
"JsPlumb provide a way to "plumb" elements of a UI together". The look is nice. The usage looks quite simple.
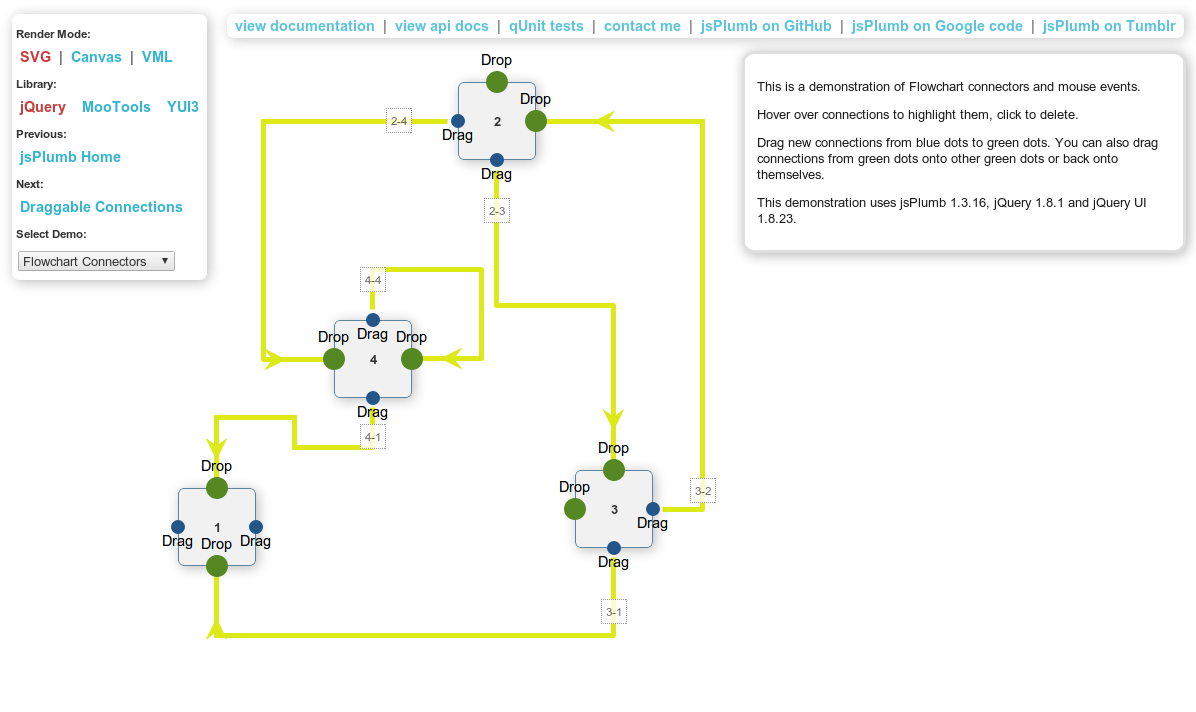
Code update : JsPlumb is actively maintained and improved by one person.
Code quality : Lack of conventions, sometimes 8 spaces, sometimes 4, ident not consistent. There is comments. It's probably quite hard to contribute since there is many copies of files to manage revisions.
Unit Testing : very large qunit test coverage. More than 1000 tests.
Github : 720 stars/100 forks
Documentation sounds quite complete.
JointJS
"JointJS is a JavaScript library for creating diagrams. The diagrams can be fully interactive. Joint library is suitable for both implementing a diagramming tool as well as simply for publishing your diagrams." The look seems somewhat old.
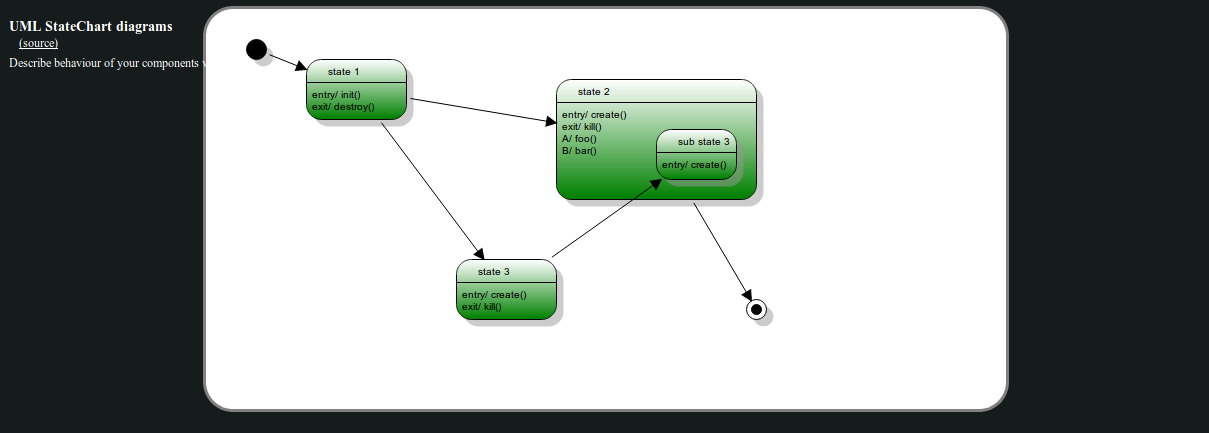
Code update : it is NOT active any more.
Code quality : easily readable. Some conventions sounds used. It is using RafaelJS.
Unit Testing : qunit folder is there but empty.
Github : 187 stars/39 forks
Documentation sounds quite complete.
Wirelt
" WireIt is an open-source javascript library, to create full-web graph editors for dataflow applications, visual programming languages, graphical modeling, or graph editors." Unfortunately, some examples looks a bit buggy, at least on latest firefox/chromium.
Code update : it is not really active. Though, they are looking to hire someone for working on it.
Code quality : easily readable. Some conventions sounds used. There is comments.
Unit Testing : Seems there is no unit tests.
Github : 342 stars/60 forks
RaphaelJS
"Raphaël is a small JavaScript library that should simplify your work with vector graphics on the web." . There is a simple example that shows a diagram. By looking at the source code, we see that Raphaël has no convenient API for what we are looking for here.
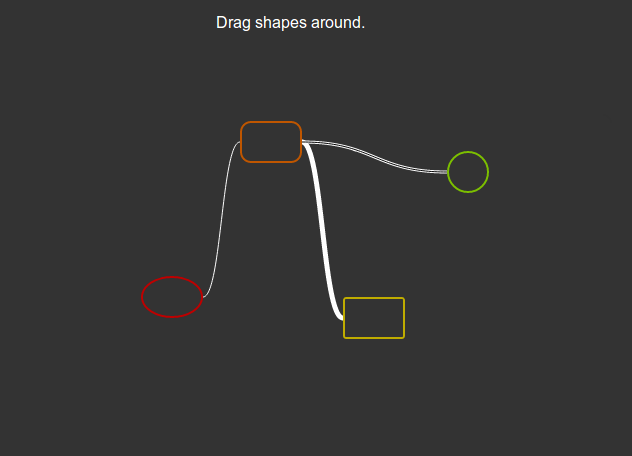
Code update : There was almost no change for one year. Like written on twitter RafaelJS account "It is not abandoned. I am just doing a big change and can’t commit until I finished.". Though it seems there is very little answers at issues or requests theses days.
Code quality : Readable code but about no comments.
Unit Testing : Not found
Github : 4775 stars/578 forks
Yuml
Javascript ??
Canviz
"Canviz is a JavaScript library for drawing Graphviz graphs to a web browser canvas. More technically, Canviz is a JavaScript xdot renderer." . It is able to generate canvas in the web browser. However we can not have interactions with them.
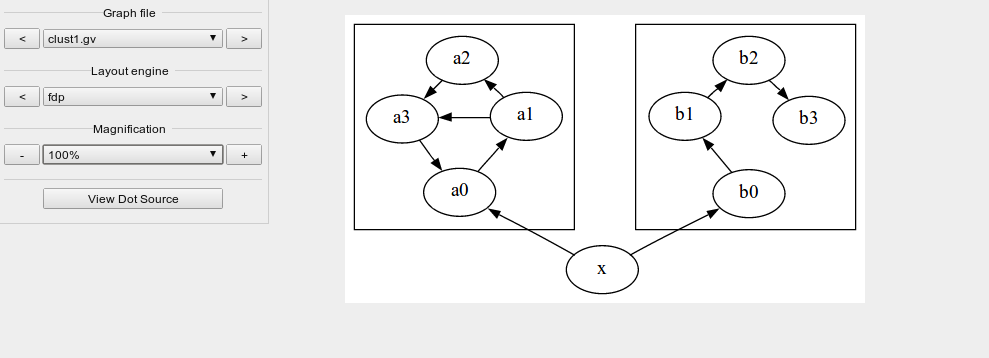
Code update : About no update for one year. It seems abandonned
Code quality : no comment. Quite readable
Unit Testing : Not found
Draw2D
Website : Draw2D

Code update : Not able to get code (even If I tried to pay for download link on their website)
Code quality : Not able to get code
Unit Testing : Not found
Opinion : Sounds very powerful. The look seems a bit old but it can be enhanced. It would be hard to contribute/improve since there is not easily accessible code.
Ajax.org
"Ajax.org Platform is a pure javascript application framework for creating real-time collaborative applications that run in the browser". It comes with a nice example allowing to view and modify a diagram.

Code Quality : Sounds nice. With comments.
Code Update : This project is active
Unit Testing : There is nice list of tests
Github : 86 stars/30 forks
D3
"D3.js is a Javascript libary for manipulating documents based on data." It is very popular, very active. It is more an amazing library for doing reports than for building diagrams.
Code Quality : Very clean and well organized.
Code Update : This project is really active
Unit Testing : There is long list of tests
Github : 13043 stars/2189 forks
Graph Dracula
"Dracula is a set of tools to display and layout interactive graphs, along with various related algorithms." It is based on RaphaelJS. It give nice list of similar tools, like we have on this page.
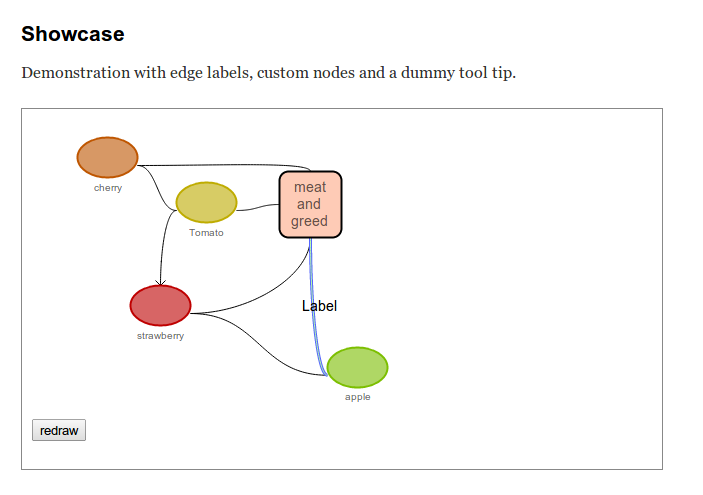
Code Quality : Clean with comments.
Code Update : This project is active
Unit Testing : Not found
Github : 241 stars/42 forks
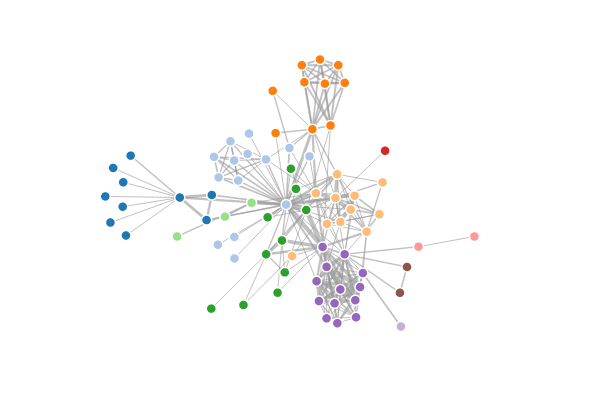
Arbor.js
"a graph visualization library using web workers and jQuery".
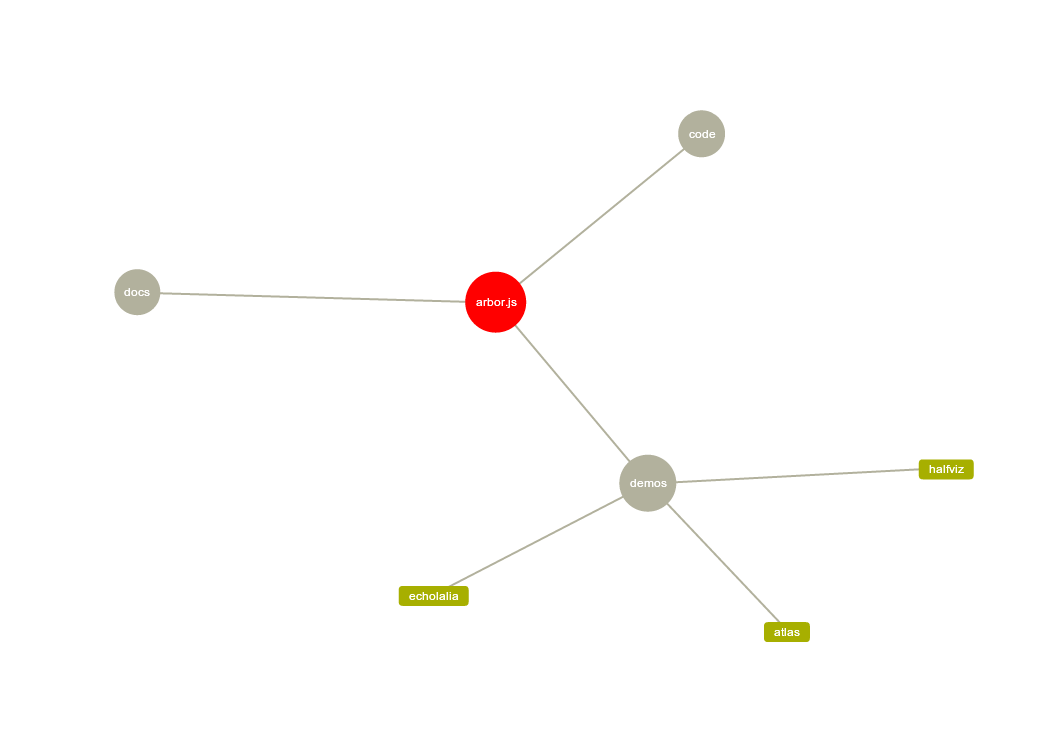
Code Quality : Clean with comments.
Code Update : This project is active
Unit Testing : Not found
Github : 1093 stars/170 forks
Js-graph-it
"a javascript library for graph representation". The graph to draw is described by html using <p> for blocks and <div> for connectors, all associated to some class names.
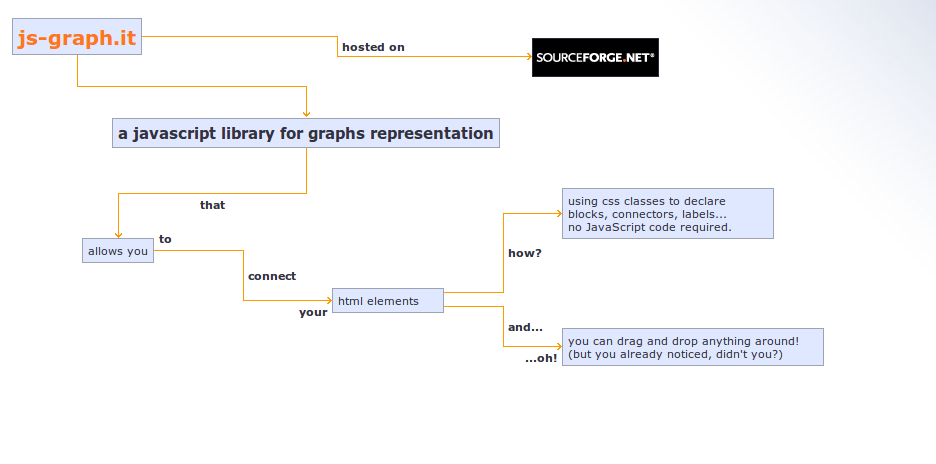
Code Quality : Ok.
Code Update : Not updated since 6 years
Unit Testing : Not found
Github : /
Score board
|
JsPlumb |
JointJS |
Wirelt |
RaphaelJS |
Canviz |
Draw2D |
ui.ajax.org |
d3 |
graph dracula |
arbor.js |
js-graph-it |
| active project |
8 |
1 |
3 |
4 |
3 |
? |
7 |
9 |
7 |
7 |
0 |
| code quality |
5 |
7 |
7 |
7 |
7 |
? |
7 |
9 |
7 |
7 |
5 |
| unit testing |
9 |
0 |
0 |
0 |
0 |
? |
8 |
9 |
0 |
0 |
0 |
| documentation |
8 |
8 |
7 |
8 |
3 |
? |
4 |
9 |
6 |
8 |
8 |
| flowcharting |
8 |
7 |
2 |
3 |
6 |
8 |
9 |
3 |
7 |
3 |
8 |
| look |
9 |
4 |
1 |
3 |
4 |
5 |
5 |
7 |
4 |
8 |
4 |
| interaction |
9 |
7 |
4 |
8 |
0 |
9 |
9 |
6 |
6 |
6 |
4 |